
Relative Strength Index (RSI)
What is RSI?
The Relative Strength Index (RSI) is a momentum oscillator that measures the speed and size of price changes.
The relative strength is calculated as the average gains divided by the average losses of the asset price over a period. The RSI compares the gains with losses by presenting the relative strength graphically, oscillating between 0 and 100.
Theoretically, if the asset price rises rapidly, the RSI can climb as high as 100. If the asset price drops rapidly, the RSI can slide as low as 0.
A 14-d period is typically used. However, you can always customize the length according to your investment goals.

What can we learn from RSI?
1. Overbought and oversold levels
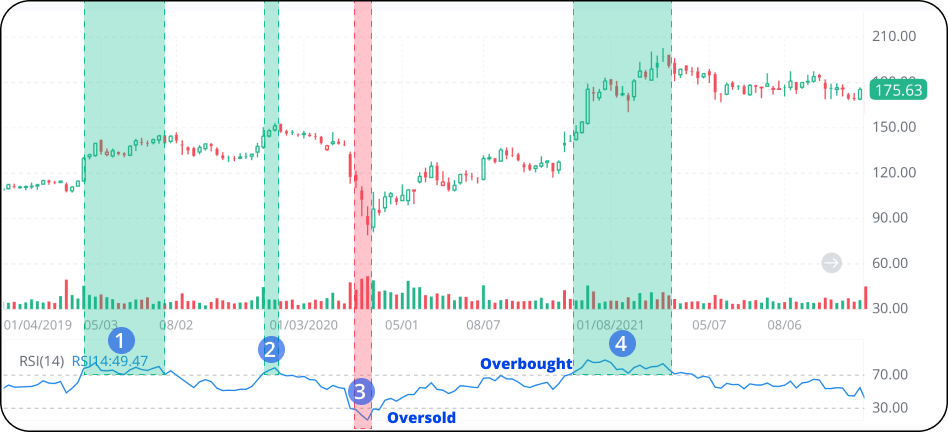
When the RSI climbs above 70, it’s considered that the asset is overbought. When the RSI drops below 30, the asset is considered oversold.
However, the RSI values for signaling overbought and oversold levels are not always fixed for every asset. You may need to try different RSI values before finding the appropriate one.
As we can see below, in periods 1, 2, and 4, the RSI has reached above 70 and stayed in the overbought area, which indicates that the upside momentum is strong. Correspondingly, we can see a sharp increase in the price chart (especially in period 4). Investors may want to sell the asset at the end of overbought periods. This is because when the RSI falls back below 70, the upside momentum weakens, and a reversal may occur.
In period 3, the RSI has dropped below 30 and stayed in the oversold area, which indicates that the downside momentum is strong. Correspondingly, we can see a steep fall in the price chart. Investors may want to buy the asset at the end of oversold periods. This is because when the RSI climbs back above 30, the downside momentum weakens, and an uptrend may pick up.
2. Divergence
When the RSI and the price are going in different directions, a divergence occurs. This is similar to the MACD line, which we discussed in previous lessons.
Bullish divergence
When the RSI reaches higher lows while the asset price is making lower lows, a bullish divergence is formed. It indicates that despite the price still falling, the downside momentum is weakened. A reversal might be on the way.

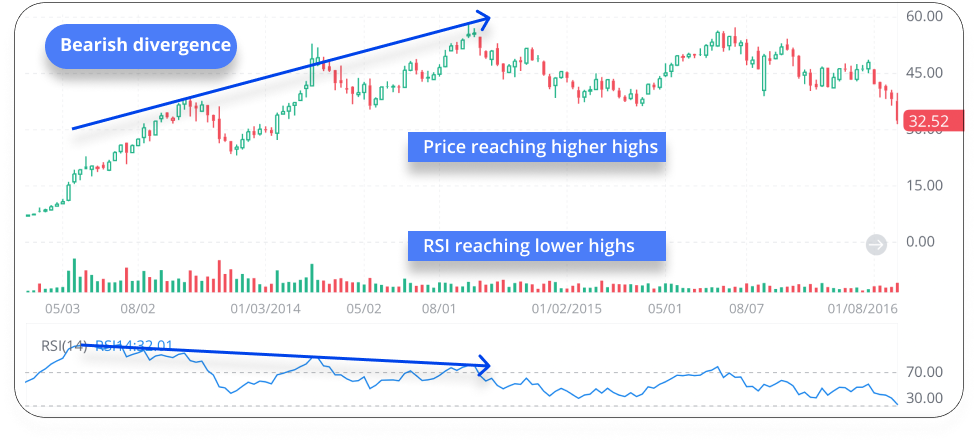
Bearish divergence
When the RSI hits lower highs while the asset price is making higher highs, a bearish divergence is formed. It indicates the upside momentum is weakened. Investors might need to look out for a downtrend.
Get a Heads-Up When Technical Signals Appear
Watching prices can be time-consuming. One simple way to watch a price efficiently is by setting a customized price alert. Check below to see how.

*Finally, please note that technical analysis is never 100% accurate. The interpretation of results is subjective.
What's More