' fill='white'%3e %3cg id='%e7%bc%96%e7%bb%84-7' transform='translate(0.000000%2c 86.000000)'%3e %3cg id='%e7%bc%96%e7%bb%84-2' transform='translate(80.533981%2c 22.000000)'%3e %3cpath d='M41.7832962%2c0 C41.9459106%2c0 42.0882746%2c0.0866854658 42.1666825%2c0.216359069 C43.8289923%2c2.66540836 44.7676281%2c5.46271319 44.7676281%2c8.43208061 C44.7676281%2c18.1345746 34.7460532%2c26 22.383814%2c26 C10.0215749%2c26 0%2c18.1345746 0%2c8.43208061 C0%2c5.46716016 0.935826425%2c2.67378733 2.58829888%2c0.223985685 C2.67109477%2c0.0916264068 2.81687473%2c0 2.9840593%2c0 C3.23130408%2c0 3.43173558%2c0.200393004 3.43173558%2c0.447590303 C3.43173558%2c0.475056669 3.42926112%2c0.501945205 3.42452292%2c0.528045226 L3.41810883%2c0.550292077 C3.37800671%2c0.861741908 3.3575721%2c1.17661276 3.3575721%2c1.49443092 C3.3575721%2c7.98336 11.2132389%2c12.5742305 22.383814%2c12.5742305 C33.5543891%2c12.5742305 41.410056%2c7.98336 41.410056%2c1.49443092 C41.410056%2c1.17865223 41.3898828%2c0.865783153 41.3502888%2c0.556288325 C41.3402868%2c0.521941442 41.3356199%2c0.48531078 41.3356199%2c0.447590303 C41.3356199%2c0.200393004 41.5360514%2c0 41.7832962%2c0 Z' id='logo%e5%a4%87%e4%bb%bd-6'%3e%3c/path%3e %3cpath d='M75.1559425%2c3.74404927 C75.7071421%2c3.74404927 76.2394493%2c3.66184338 76.7416414%2c3.50883715 L74.281987%2c20.8666902 C74.0430787%2c22.5662954 73.2732628%2c23.0518969 71.8929033%2c23.0518969 L70.459453%2c23.0518969 C69.2649111%2c23.0518969 68.6278221%2c22.458384 68.2561868%2c20.893668 L66.1591022%2c11.9909739 C66.1060114%2c11.7481731 66.1060114%2c11.6942174 65.9998299%2c11.6942174 C65.8936484%2c11.6942174 65.867103%2c11.7481731 65.8140123%2c11.9909739 L63.7169276%2c20.893668 C63.3452924%2c22.458384 62.7082033%2c23.0518969 61.5136614%2c23.0518969 L60.0802112%2c23.0518969 C58.6998516%2c23.0518969 57.9300358%2c22.5662954 57.6911274%2c20.8666902 L55.2123917%2c3.37406084 C55.8253692%2c3.61307396 56.491017%2c3.74404927 57.1867652%2c3.74404927 C57.7974457%2c3.74404927 58.3849364%2c3.64314414 58.9339751%2c3.4568446 L60.8234817%2c19.3829078 C60.8500271%2c19.6257086 60.8500271%2c19.7875757 60.9562086%2c19.7875757 C61.0623901%2c19.7875757 61.0623901%2c19.6257086 61.1154808%2c19.3829078 L63.3983831%2c9.91367858 C63.5576554%2c9.26620991 63.9292906%2c8.69967483 65.0707418%2c8.69967483 L66.9023727%2c8.69967483 C68.0438238%2c8.69967483 68.4154591%2c9.26620991 68.5747313%2c9.91367858 L70.8576336%2c19.3829078 C70.9107244%2c19.6257086 70.9107244%2c19.7875757 71.0169059%2c19.7875757 C71.1230874%2c19.7875757 71.1230874%2c19.6257086 71.1496327%2c19.3829078 L73.0551401%2c3.32292288 C73.7026096%2c3.59432921 74.4120718%2c3.74404927 75.1559425%2c3.74404927 Z' id='Combined-Shape'%3e%3c/path%3e %3cpath d='M85.0594095%2c7.43171536 C89.1473973%2c7.43171536 91.3772089%2c10.2643908 91.3772089%2c14.2840921 L91.3772089%2c15.7948523 C91.3772089%2c16.2264981 91.2179366%2c16.4692988 90.8463013%2c16.4692988 L82.1925089%2c16.4692988 L82.1925089%2c16.5502324 C82.1925089%2c18.1149484 82.829598%2c19.9764208 85.377954%2c19.9764208 C87.3157664%2c19.9764208 89.1473973%2c19.8145536 90.2623031%2c19.7066422 L90.3419392%2c19.7066422 C90.607393%2c19.7066422 90.819756%2c19.8415315 90.819756%2c20.1113101 L90.819756%2c21.8918489 C90.819756%2c22.3234947 90.7401198%2c22.5123397 90.2623031%2c22.5932733 C88.5368537%2c22.9170076 87.501584%2c23.0518969 85.1125002%2c23.0518969 C82.4579627%2c23.0518969 78.6885194%2c21.5950924 78.6885194%2c16.2804538 L78.6885194%2c14.2840921 C78.6885194%2c10.0755457 80.997967%2c7.43171536 85.0594095%2c7.43171536 Z M85.0594095%2c10.5071915 C83.4135962%2c10.5071915 82.2190543%2c11.6942174 82.2190543%2c13.8254684 L82.2190543%2c13.9333799 L87.8466739%2c13.9333799 L87.8466739%2c13.8254684 C87.8466739%2c11.7211953 86.7052228%2c10.5071915 85.0594095%2c10.5071915 Z' id='Combined-Shape'%3e%3c/path%3e %3cpath d='M97.88151%2c2.98826245 L97.8808258%2c7.62056039 C98.8630047%2c7.48567108 99.7920929%2c7.43171536 100.429182%2c7.43171536 C104.702987%2c7.43171536 106.773527%2c9.99461216 106.773527%2c14.2031585 L106.773527%2c16.2804538 C106.773527%2c20.4890001 104.702987%2c23.0518969 100.429182%2c23.0518969 C98.7302779%2c23.0518969 96.7393747%2c22.7821183 95.0935614%2c22.3504725 C94.4830178%2c22.1886054 94.3768363%2c22.0267382 94.3768363%2c21.6220703 L94.3758373%2c3.08694115 C94.884566%2c3.24434375 95.4244809%2c3.32900525 95.9838525%2c3.32900525 C96.6506785%2c3.32900525 97.2898545%2c3.20869291 97.88151%2c2.98826245 Z M100.429182%2c10.3453244 C99.7920929%2c10.3453244 98.6240964%2c10.4262579 97.8808258%2c10.5341694 L97.8808258%2c19.9494429 C98.385188%2c20.0573544 99.4735484%2c20.1382879 100.429182%2c20.1382879 C102.712084%2c20.1382879 103.269537%2c18.4926384 103.269537%2c16.2804538 L103.269537%2c14.2031585 C103.269537%2c11.9909739 102.712084%2c10.3453244 100.429182%2c10.3453244 Z' id='Combined-Shape'%3e%3c/path%3e %3cpath d='M111.502687%2c8.72457747 C112.045508%2c8.72457747 112.570006%2c8.64485191 113.065463%2c8.49629404 L113.064781%2c16.5232546 C113.064781%2c19.3289521 114.073505%2c19.9764208 115.613137%2c19.9764208 L115.772409%2c19.9764208 C117.312041%2c19.9764208 118.320765%2c19.3289521 118.320765%2c16.5232546 L118.320226%2c8.4334735 C118.872544%2c8.62226395 119.463958%2c8.72457747 120.078886%2c8.72457747 C120.689352%2c8.72457747 121.276644%2c8.62374317 121.825517%2c8.43756894 L121.824755%2c16.5232546 C121.824755%2c22.4044283 117.338586%2c23.0518969 115.772409%2c23.0518969 L115.526483%2c23.0512514 C113.88817%2c23.0271041 109.560791%2c22.2994073 109.560791%2c16.5232546 L109.560465%2c8.36700801 C110.164542%2c8.59813531 110.819085%2c8.72457747 111.502687%2c8.72457747 Z' id='Combined-Shape'%3e%3c/path%3e %3cpath d='M128.780182%2c3.03790128 L128.779643%2c22.269539 C128.779643%2c22.5662954 128.56728%2c22.836074 128.275281%2c22.836074 L125.806561%2c22.836074 C125.514562%2c22.836074 125.275653%2c22.5662954 125.275653%2c22.269539 L125.275475%2c3.04219481 C125.82418%2c3.22824247 126.411273%2c3.32900525 127.021522%2c3.32900525 C127.63645%2c3.32900525 128.227864%2c3.22669173 128.780182%2c3.03790128 Z' id='Combined-Shape'%3e%3c/path%3e %3cpath d='M134.372549%2c3.32900525 C134.939348%2c3.32900525 135.48617%2c3.24208064 136.000812%2c3.08063296 L135.999985%2c22.269539 C135.999985%2c22.5662954 135.787622%2c22.836074 135.495623%2c22.836074 L133.026903%2c22.836074 C132.734904%2c22.836074 132.495995%2c22.5662954 132.495995%2c22.269539 L132.495929%2c2.99605058 C133.081688%2c3.21152525 133.713619%2c3.32900525 134.372549%2c3.32900525 Z' id='Combined-Shape'%3e%3c/path%3e %3c/g%3e %3c/g%3e %3c/g%3e %3c/g%3e%3c/svg%3e)



Artificial intelligence stocks have attracted significant capital from Singapore investors seeking exposure to one of the most consequential technology shifts in decades. Yet assessing AI valuations requires more than checking a price-to-earnings ratio, the sector's growth dynamics, capital intensity, and earnings uncertainty requires a multi-metric framework. This guide explains how to assess AI valuations systematically, with tools and context relevant to investors trading US and global AI stocks from Singapore.
Key Takeaways
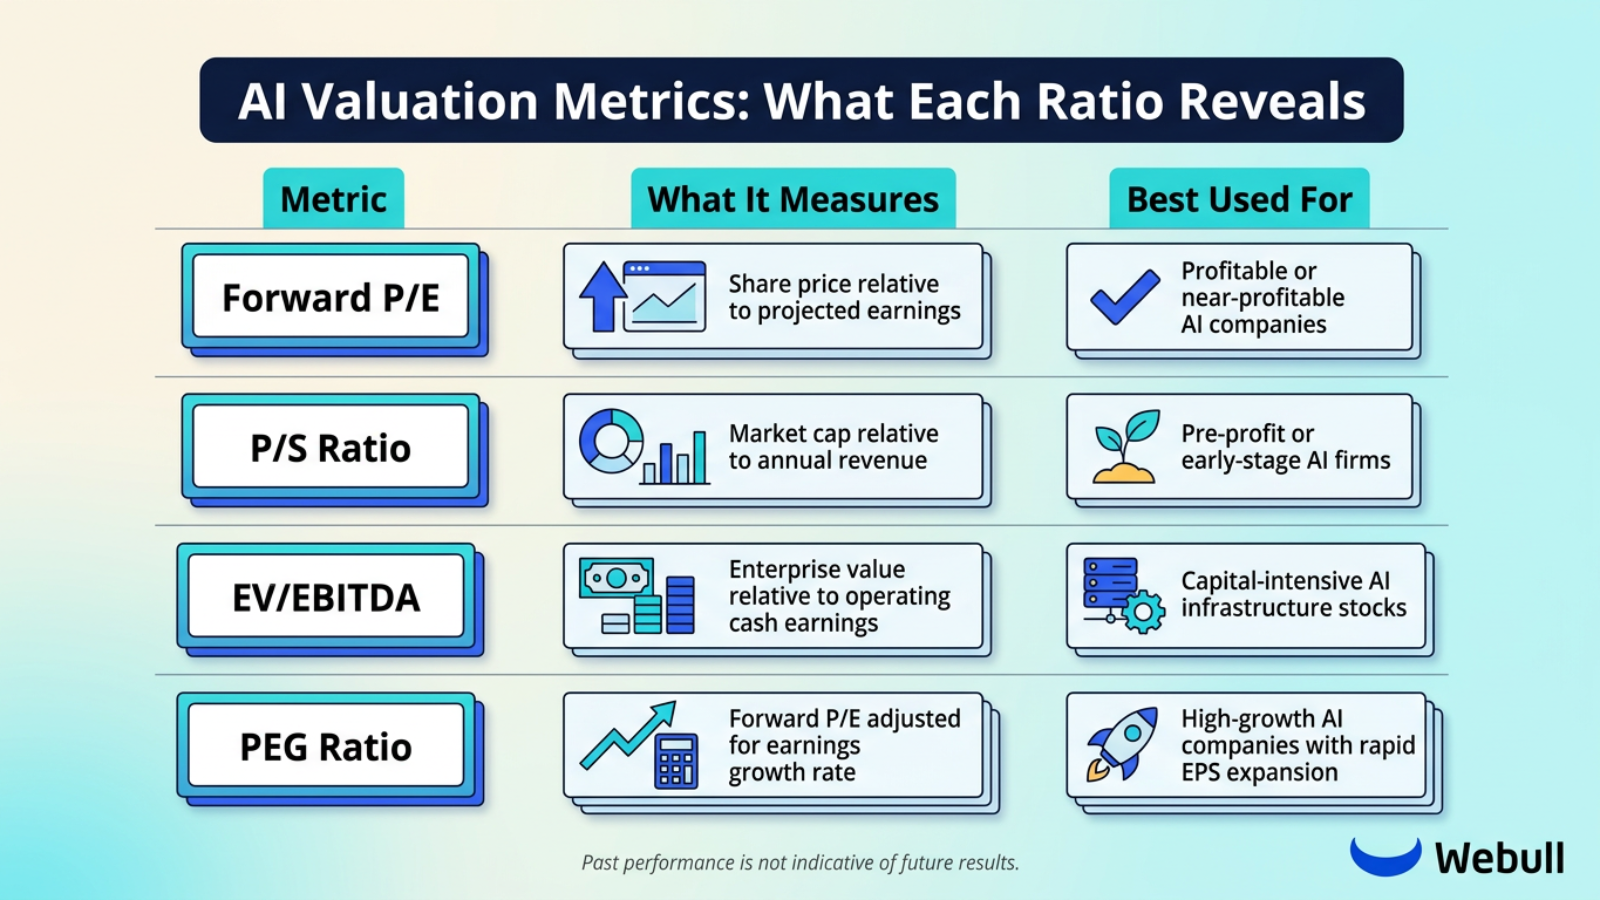
AI valuations cannot be assessed with a single metric; forward P/E, P/S, EV/EBITDA, and PEG ratios each reveal different dimensions.
Hyper-scaler Capex-to-revenue ratios are a critical watch signal specific to AI infrastructure stocks.
Singapore investors trading US-listed AI stocks are subject to a different regulatory regime than those investing in SGX-listed products. Understand the differences in risks before investing.
Past performance is not indicative of future results.
Part 1: Why Standard Valuation Metrics Fall Short for AI Stocks
1.1 The Earnings Problem in High-Growth AI Companies
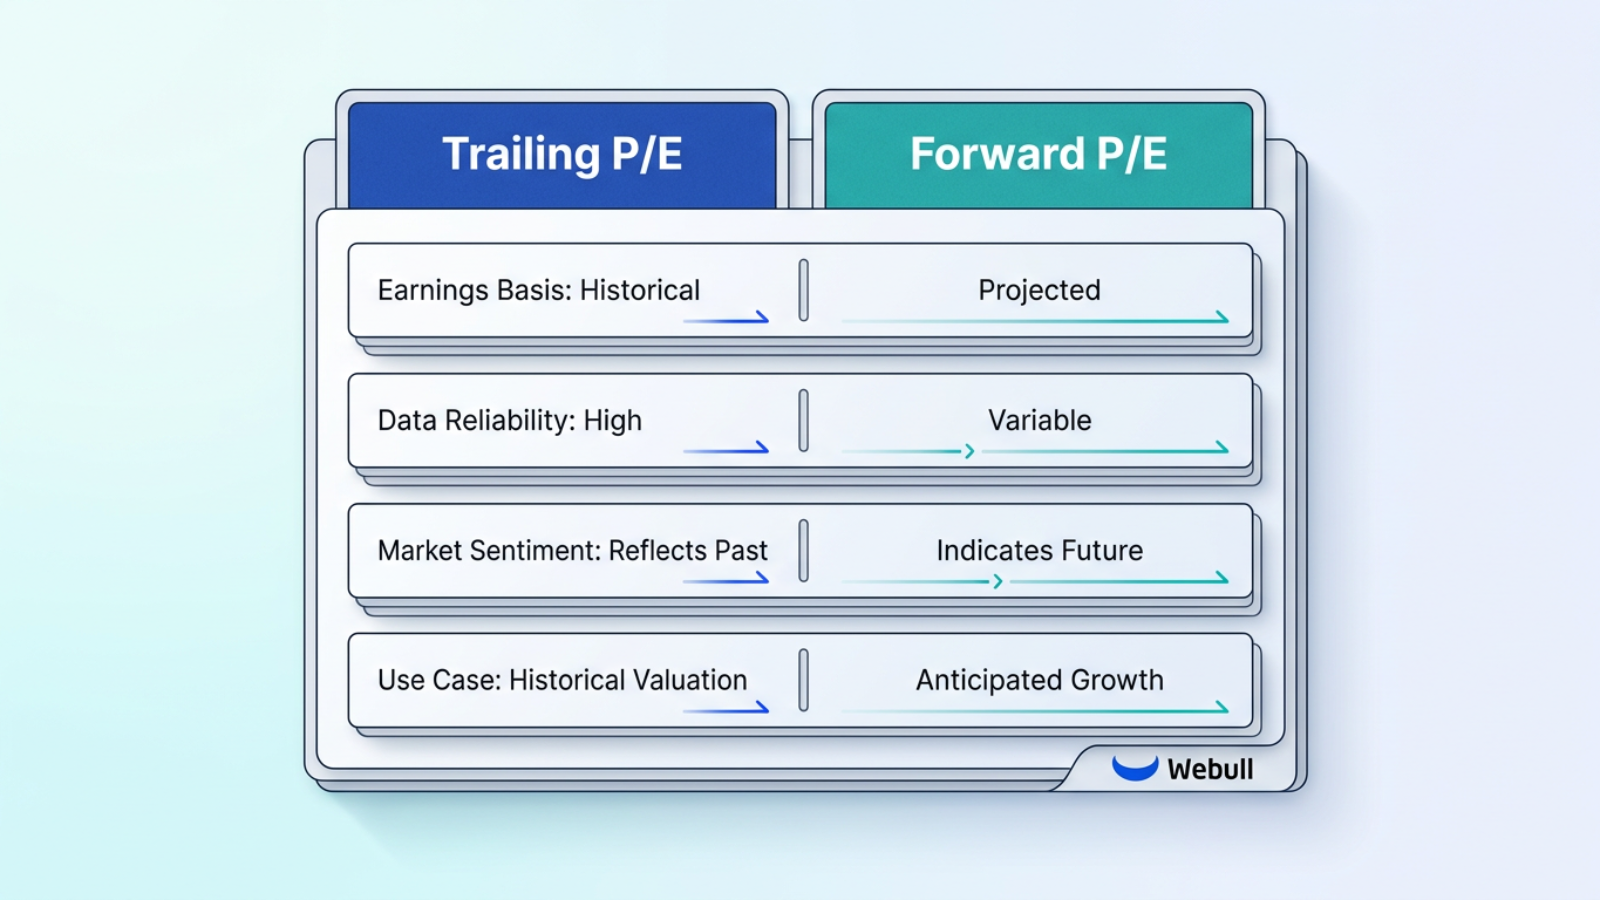
Traditional valuation relies on earnings. However, many AI companies either report losses or generate earnings that are small relative to their share prices. A trailing price-to-earnings (P/E) ratio can therefore be uninformative or negative for early-stage AI firms. Even for profitable AI companies, trailing earnings may significantly understate future earning potential if the business is scaling rapidly.
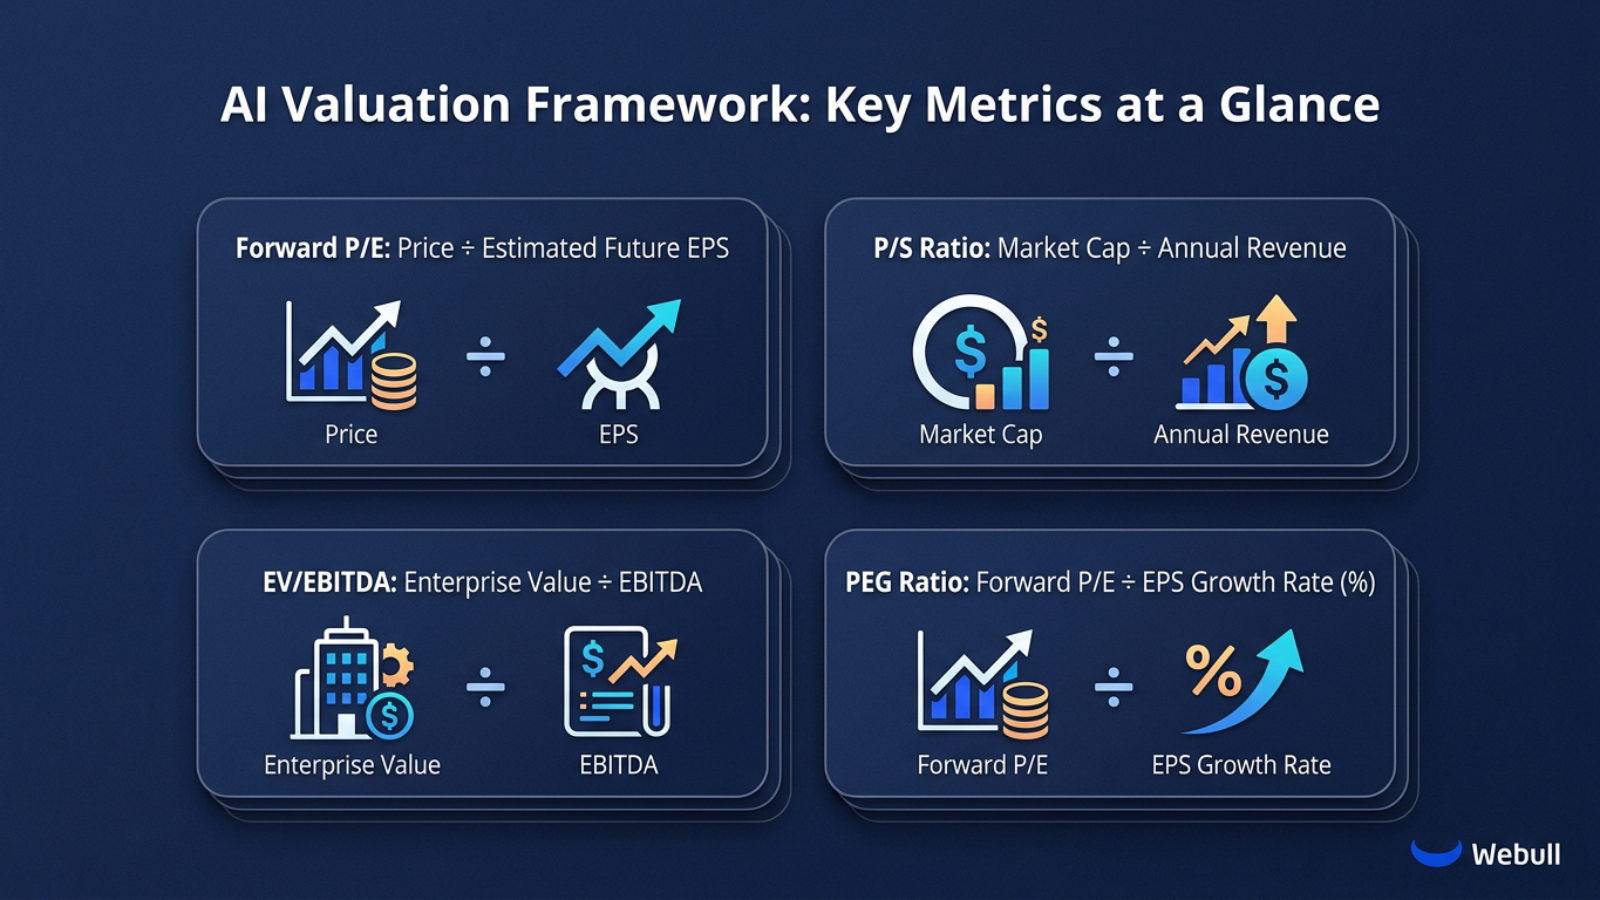
The forward P/E ratio addresses this partially. It divides the current share price by analysts' consensus estimate of earnings per share (EPS) over the next 12 months:
Forward P/E = Current Share Price ÷ Estimated Future EPS
A stock trading at S$50 with a projected EPS of S$5 has a forward P/E ratio of 10, meaning investors pay S$10 for every S$1 of anticipated earnings. The reliability of this metric depends entirely on the accuracy of EPS forecasts, which are inherently uncertain in fast-moving sectors.
1.2 When Forward P/E Misleads
High forward P/E ratios in AI stocks often reflect genuine growth expectations rather than overvaluation. However, they can also reflect speculative enthusiasm that runs ahead of fundamentals. Context is essential:
A high forward P/E may be justified if the company is expanding into a large addressable market with durable competitive advantages.
A low forward P/E may signal structural challenges, regulatory risks, or market scepticism. It does not necessarily indicate a bargain.
For AI infrastructure companies with massive capital expenditure programmes, reported earnings may be suppressed by depreciation, making P/E ratios appear elevated even when cash generation is strong.
Investors should treat forward P/E as a starting point, not a conclusion.
Part 2: Core Valuation Metrics for AI Stocks in the Singapore Investor Context
2.1 Price-to-Sales (P/S) Ratio
For AI companies that are pre-profit or early in their monetisation cycle, the price-to-sales ratio (P/S) offers a useful alternative. It compares market capitalisation to annual revenue, bypassing the earnings line entirely.
P/S = Market Capitalisation ÷ Annual Revenue
A high P/S ratio suggests that investors are paying a premium for revenue growth potential. This is common among AI software and platform companies with high gross margins and a credible path to profitability. However, it also means that the stock may be sensitive to any disappointment in revenue growth.
Webull's platform displays P/S data alongside other fundamental metrics, allowing Singapore investors to compare AI stocks across sectors and geographies from a single interface. You can explore these tools via the Webull Singapore trading platform.
2.2 EV/EBITDA for Capital-Intensive AI Infrastructure
Enterprise Value to EBITDA (EV/EBITDA) is particularly relevant for AI infrastructure companies, including data centre operators, semiconductor manufacturers, and power providers, where capital expenditure is substantial and depreciation materially affects reported earnings.
EV/EBITDA = Enterprise Value ÷ Earnings Before Interest, Tax, Depreciation & Amortisation
By adding back depreciation and amortisation, EV/EBITDA provides a cleaner view of operating cash generation. For AI infrastructure stocks, where hyperscalers are spending hundreds of billions of dollars on physical assets, this metric helps investors assess whether the underlying business generates sufficient operating cash flow to justify its valuation.
2.3 PEG Ratio: Adjusting for Growth
The Price/Earnings-to-Growth (PEG) ratio adjusts the forward P/E for expected earnings growth:
PEG = Forward P/E ÷ Expected EPS Growth Rate (%)
A PEG ratio below 1.0 is often interpreted as potentially undervalued relative to growth, while a ratio above 1.0 may suggest that the market is pricing in optimistic assumptions. For AI stocks with high annual earnings growth rates, a high forward P/E ratio may still result in a reasonable PEG ratio. However, this depends heavily on whether the growth rate is sustainable.
2.4 Key Metrics Available on Webull SG
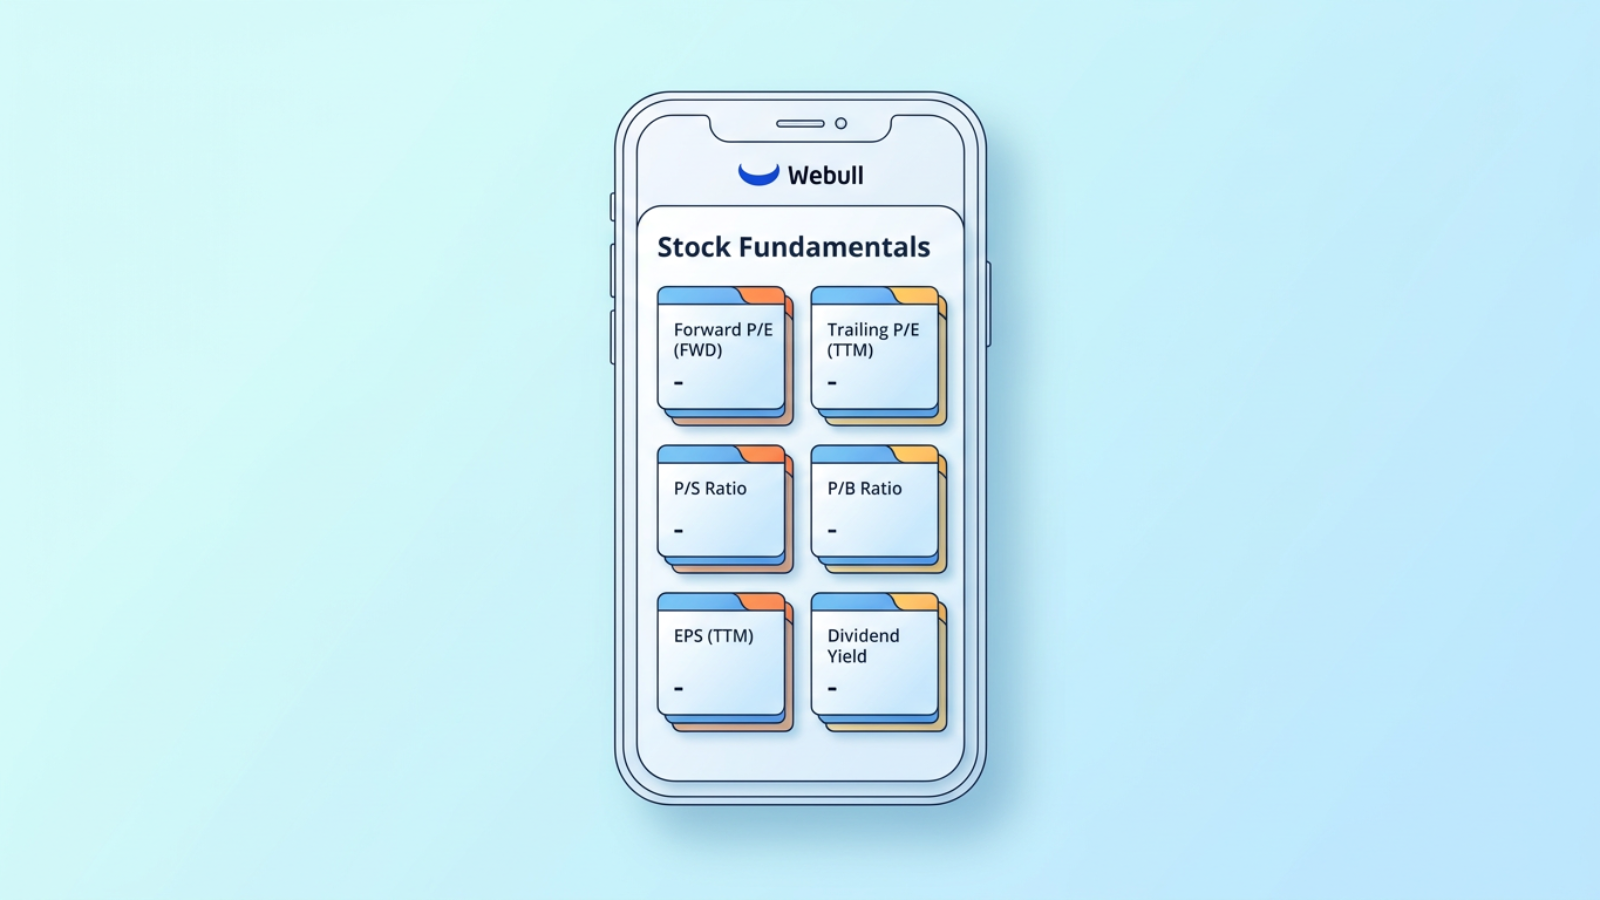
Webull Singapore provides a comprehensive suite of fundamental data points relevant to AI stock analysis, including:
Market capitalisation and free-float market cap
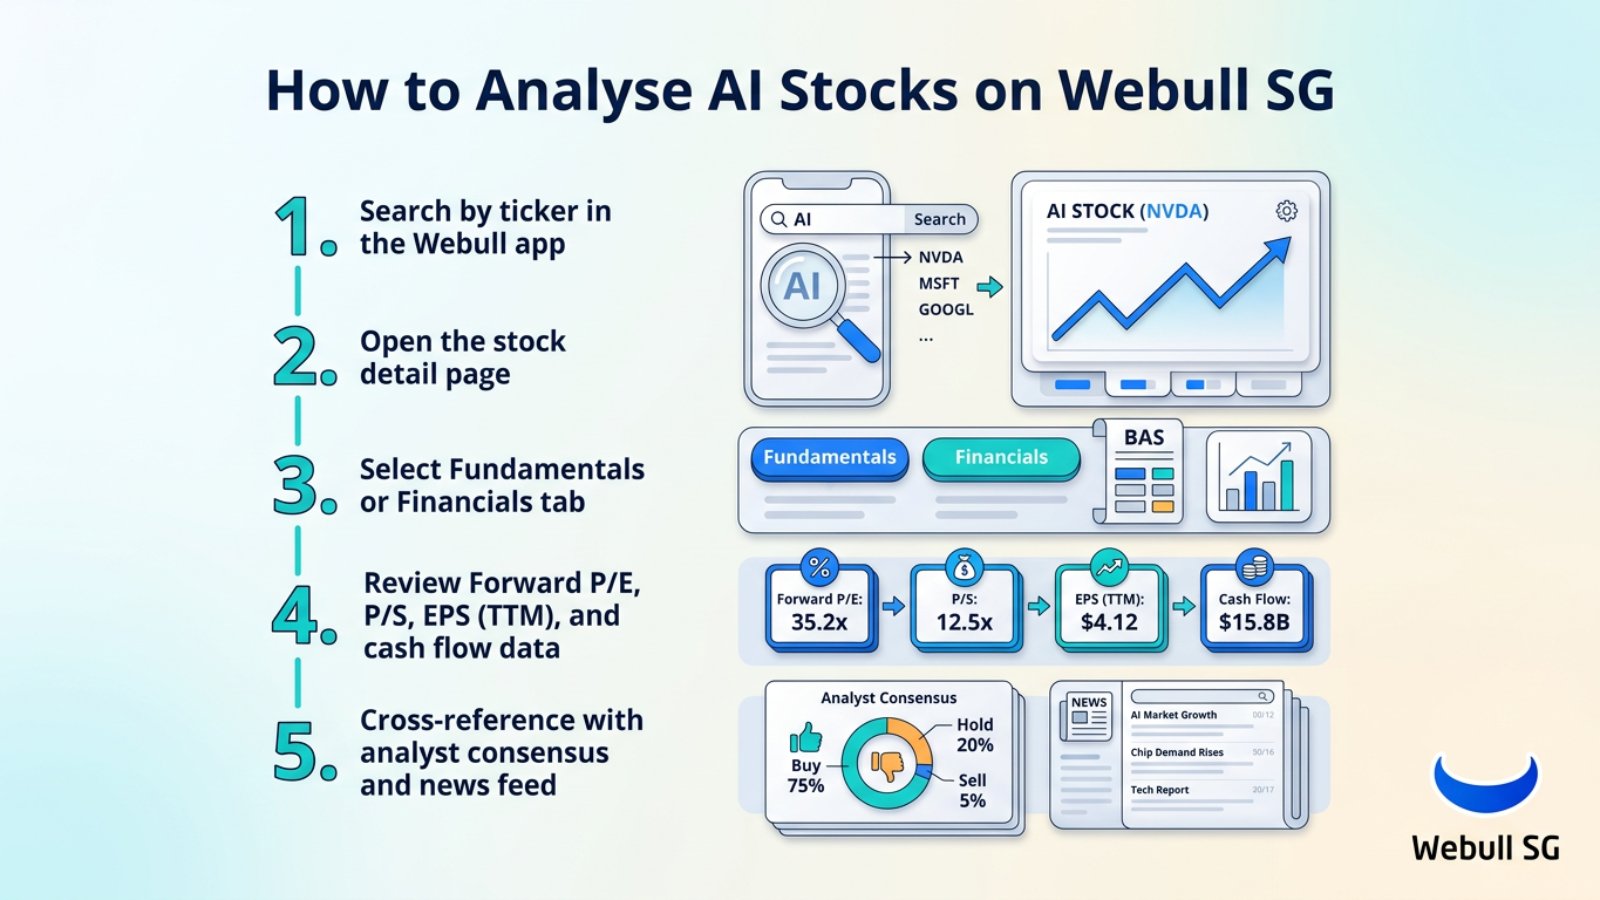
Trailing P/E (TTM) and Forward P/E (FWD): the forward P/E uses consensus estimates for EPS in the next fiscal year, which has not yet been reported.
Price-to-Book (P/B) ratio
Price-to-Sales (P/S) ratio: calculated using revenue from the past four quarters on a TTM basis, except for Hong Kong-listed stocks
Dividend yield: annual dividend divided by the latest stock price
EPS (TTM): the sum of diluted EPS for the past four quarters
Part 3: AI-Specific Valuation Signals Singapore Investors Should Monitor
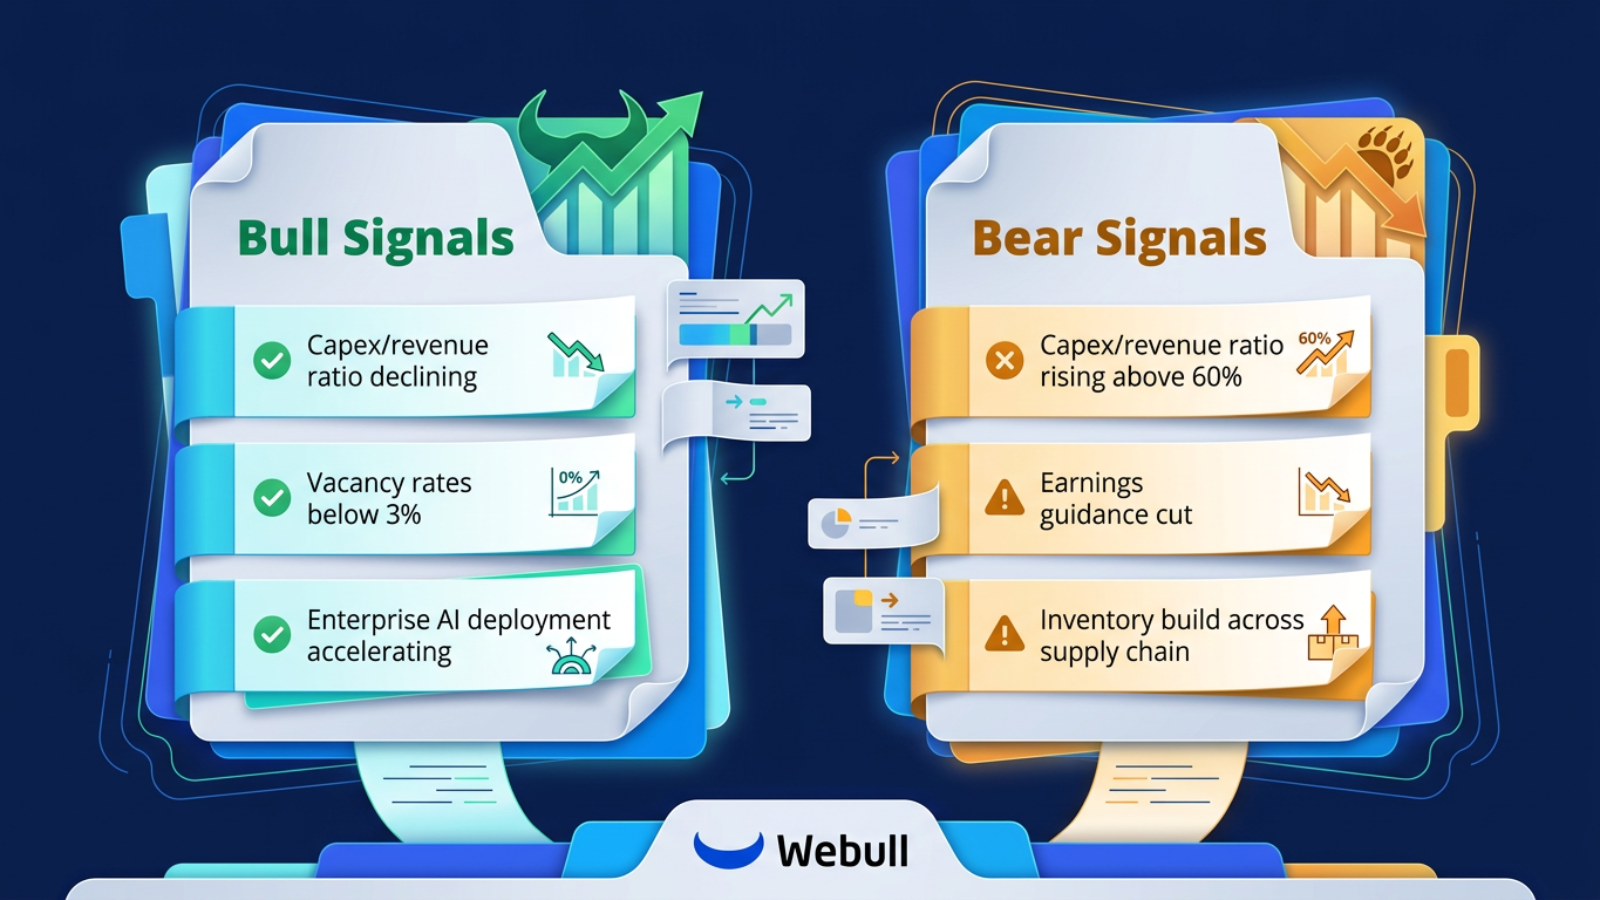
3.1 Capex-to-Revenue Ratio: A Key Signal for AI Infrastructure
For AI infrastructure stocks, including semiconductor companies, data centre operators, and hyperscale cloud providers, the capex-to-revenue ratio has emerged as a critical valuation signal. It measures how much of each dollar of revenue is being reinvested in physical infrastructure.
According to publicly available research, the five largest hyperscale cloud operators were expected to spend approximately US$775 billion to US$800 billion in combined capital expenditure in 2026, representing capex-to-revenue ratios ranging from 31% to 83%, depending on the company. These ratios, historically seen only in capital-intensive utilities and telecommunications, reflect the scale of AI infrastructure investment underway.
Why this matters for valuation:
A rising capex-to-revenue ratio signals that companies are spending ahead of revenue realisation, serving as an amber watch signal.
A declining ratio signals that AI cloud revenue is scaling to match investment, potentially acting as a catalyst for a re-rating.
Investors should monitor this metric quarterly alongside earnings releases.
3.2 Semiconductor Cycle Positioning
AI semiconductor stocks are subject to inventory cycles that can compress valuations sharply even when long-term demand remains intact. The semiconductor industry has historically experienced downcycles every three to four years, driven by capacity mismatches and inventory imbalances.
Key signals to monitor when assessing AI semiconductor valuations:
Global semiconductor sales growth rate: when growth peaks and begins to decelerate, valuations typically compress
Inventory levels across the supply chain: elevated channel inventory can precede order cuts
Utilisation rates at leading foundries: declining utilisation can signal weakening demand
Earnings guidance revisions: downward revisions from major AI chip companies can serve as leading indicators
3.3 Earnings Quality and Depreciation Schedules
AI infrastructure companies depreciate hardware assets over five to six years, while the economic useful life of AI accelerators may be closer to three to four years due to rapid generational improvements. This mismatch means reported earnings may overstate true profitability if depreciation charges do not reflect the actual pace of asset obsolescence.
When assessing AI valuations, examine:
Depreciation policy relative to hardware refresh cycles
Free cash flow versus reported net income: a significant divergence may indicate aggressive accounting practices
Capital expenditure commitments versus operating cash flow generation
3.4 Sovereign AI and Demand Floor Considerations
Beyond commercial hyperscaler spending, national AI infrastructure programmes represent a demand layer that is not always captured in standard analyst models. This sovereign AI demand may provide a floor under AI infrastructure spending that pure commercial analysis would underestimate.
Singapore investors assessing AI infrastructure stocks should consider whether analyst consensus estimates incorporate sovereign AI demand, or whether this represents an upside scenario not yet priced in.
Part 4: How to Assess AI Valuations Using Webull SG's Platform Tools
4.1 Accessing Fundamental Data on Webull
Webull Singapore provides Singapore investors with access to real-time and historical fundamental data for US-listed, SGX-listed, Hong Kong-listed, and China A-share stocks. For AI stock analysis, the platform's stock detail pages display the core valuation metrics discussed in this guide.
Webull Singapore also provides OTC Markets Level 1 data from OTC Markets Group for OTC-traded securities, including tick-by-tick transactions and real-time best bid and offer pricing for OTCQX, OTCQB, and Pink securities. This may be relevant for investors tracking smaller AI companies that are not yet listed on major exchanges.
4.2 Comparing AI Stocks Across Markets
Singapore investors can access US, SGX, Hong Kong, and China A-share markets through Webull SG, enabling cross-market comparison of AI valuations. This is particularly useful when assessing whether US-listed AI semiconductor stocks are priced at a premium relative to Asian equivalents, or when evaluating AI-adjacent plays listed on SGX.
When trading US-listed AI stocks from Singapore, note that such products are subject to a different regulatory regime and legal system than SGX-listed products. Investors should review the Risk Warning Statement applicable to overseas-listed investment products under MAS Notice SFA04-N12 before trading.
Rates vary by service provider; please refer to the latest pricing on the official Webull Singapore website for current commission structures and fees applicable to US and SG stock trading. US stock commissions are typically quoted in USD; SG stock commissions in SGD.
Part 5: Regulatory and Risk Considerations for Singapore AI Investors
5.1 MAS Regulation and Platform Safety
Webull Singapore operates under a Capital Markets Services (CMS) Licence issued by the Monetary Authority of Singapore (MAS), which regulates it as a licensed dealer under the Securities and Futures Act (SFA). Singapore investors should verify the licensing status of any broker they use via the MAS Financial Institutions Directory at mas.gov.sg.
Client asset protection in Singapore operates through MAS-mandated segregation of client money and assets under the SFA and related MAS Notices, rather than through a government-backed investor compensation scheme. Singapore does not operate an investor compensation scheme equivalent to the US SIPC. Segregation requirements are designed to protect client assets in the event of a broker's insolvency, but they are distinct from a guarantee of asset value.
MAS licensing status may be verified factually but does not constitute an endorsement of any firm's products or investment outcomes.
MAS — https://www.mas.gov.sg
5.2 CDP vs Custodian Account Structure
CDP (Central Depository) account: A direct securities account held with the Central Depository (Pte) Limited, a subsidiary of SGX. SGX-listed shares purchased through a CDP-linked broker are registered in the investor's own name and held at CDP. This structure provides direct ownership.
Custodian account: Securities are held in the broker's name on behalf of the client. Most overseas-listed stocks (including US AI stocks) are held in custodian accounts. Investors have beneficial ownership but not direct registration. Client assets must be segregated from the broker's own assets under SFA requirements.
For Singapore investors trading US-listed AI stocks through Webull SG, holdings are maintained in a custodian structure. Understanding this distinction is important when assessing counterparty risk.
5.3 Tax Treatment for Singapore AI Investors
Singapore does not impose capital gains tax. Gains from the sale of shares and other financial instruments held as personal investments are generally not taxable in Singapore. However, individuals who trade frequently or whose primary income derives from trading may be assessed as carrying on a trade, in which case profits may be subject to income tax.
This content does not constitute tax advice. Individual tax outcomes depend on personal circumstances. Investors should refer to IRAS guidance or a licensed tax professional for their specific situation.
IRAS — https://www.iras.gov.sg
5.4 Key Risks When Investing in AI Stocks from Singapore
Investing in AI stocks carries specific risks that Singapore investors should understand before committing capital:
Valuation risk: AI stocks often trade at elevated multiples that assume sustained high growth; any earnings disappointment can trigger sharp price corrections.
Technology risk: Rapid innovation means today's market leaders may face disruption from more efficient architectures or competing platforms.
Geopolitical risk: Export controls on advanced semiconductors and US-China technology tensions can materially affect AI company revenues and supply chains.
Currency risk: US-listed AI stocks are denominated in USD; Singapore investors bear USD/SGD exchange rate exposure.
Regulatory risk: Evolving AI regulation across major markets may affect the business models of AI companies.
Concentration risk: The AI theme is concentrated in a small number of large-capitalisation stocks; sector-specific downturns can produce significant portfolio drawdowns.
Past performance is not indicative of future results.
The Bottom Line
Assessing AI valuations requires a multi-metric framework. Forward P/E, P/S, EV/EBITDA, PEG, and capex-to-revenue ratios each provide different insights into valuation and risk. Webull Singapore provides the fundamental data, screening tools, and multi-market access that Singapore investors need to apply this framework systematically. Always assess AI stocks within their sector context, monitor earnings guidance closely, and understand the regulatory and currency risks involved before investing.
Open a Webull Singapore account to access AI stock fundamentals, real-time data, and multi-market trading.
Disclosure
All investments involve risks and are not suitable for every investor. The information provided is generated with the assistance of artificial intelligence based on publicly available sources and is for informational purposes only.
The content provided above is for educational purposes only and does not constitute financial, investment, or professional advice. No information herein should be relied upon for making financial or investment decisions. No content should be construed as investment advice or recommendation, or an offer or solicitation, to deal in any investment product. Investors may wish to seek advice from a financial adviser before investing. In the event that investors choose not to seek advice from a financial adviser, they should consider whether the investment is suitable for them. For more information, please refer to our website at https://www.webull.com.sg.
This advertisement has not been reviewed by the Monetary Authority of Singapore.
